|
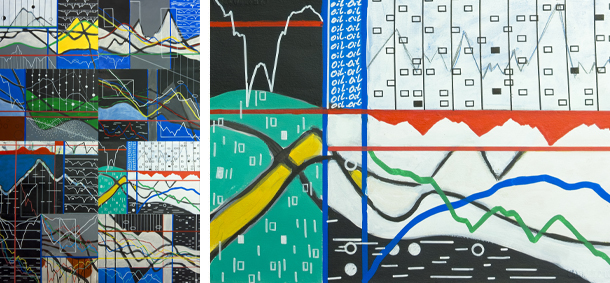
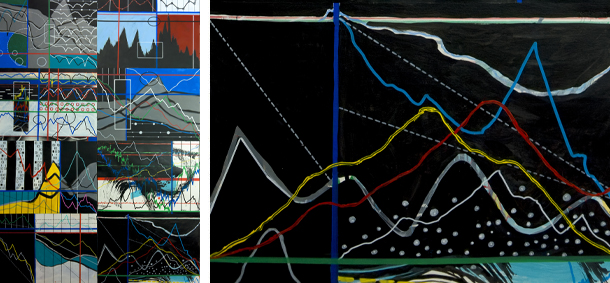
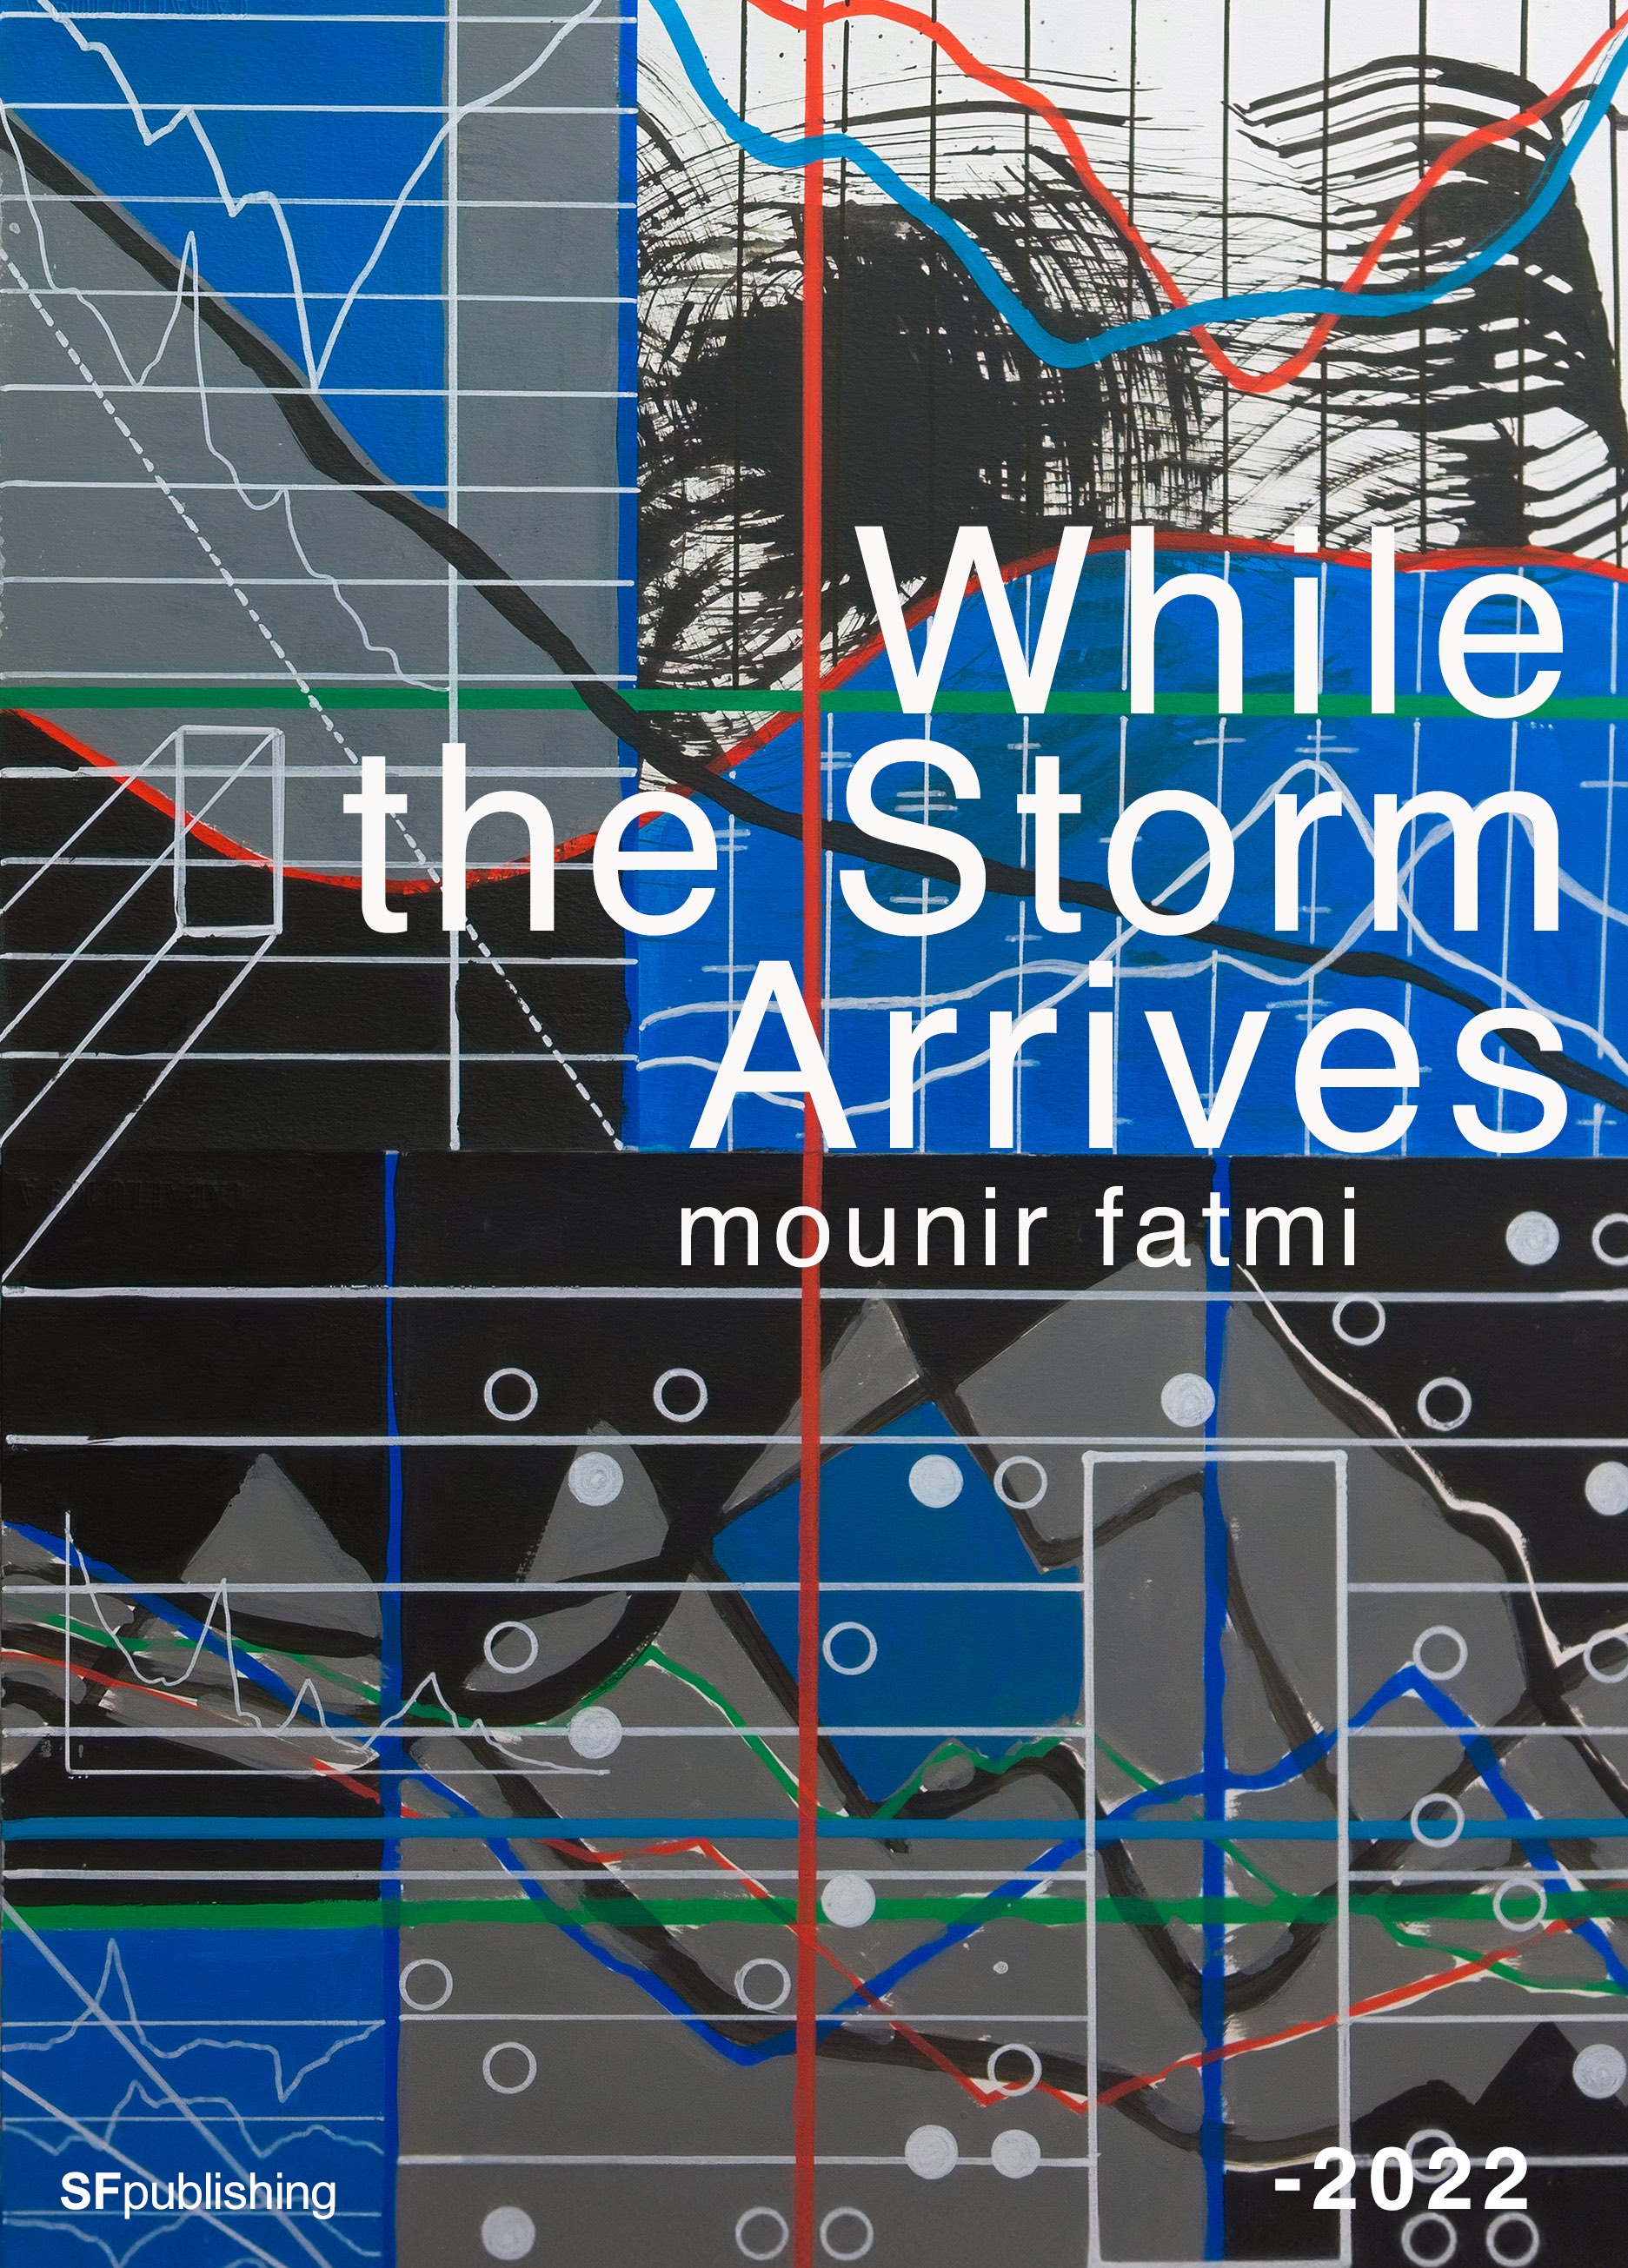
Depuis le début de sa recherche artistique, mounir fatmi s’est inspiré des signes et des formes calligraphiques arabes. La découverte des peintures de Brion Gysin à Tanger dans les années 80, lui a permis de voir ces dernières sous un autre angle, celui d’un langage universel. En 2014, il associe à ces formes calligraphiques d’autres dessins géométriques inspirés cette fois des courbes de la bourse. Il découvre ainsi cet alphabet abstrait et complexe qui constitue le langage économique. Il commence alors la série de dessins et de peintures, « Calligraphies de l’inconnu ». Déclarant : "Pour comprendre le monde, il faut prendre le pouls des marchés financiers, mais aussi des marchés aux puces."
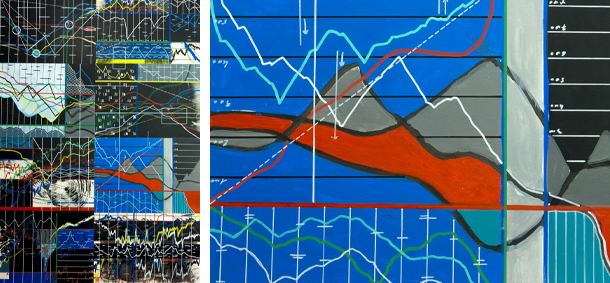
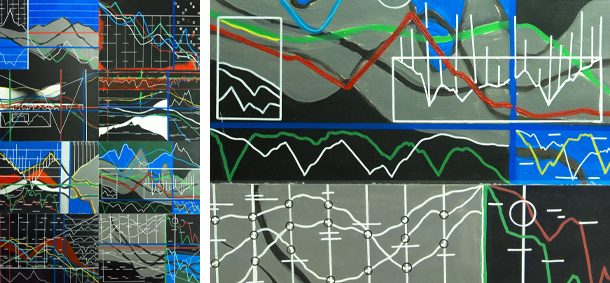
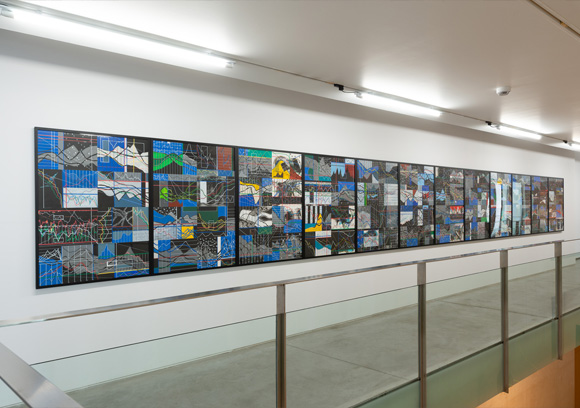
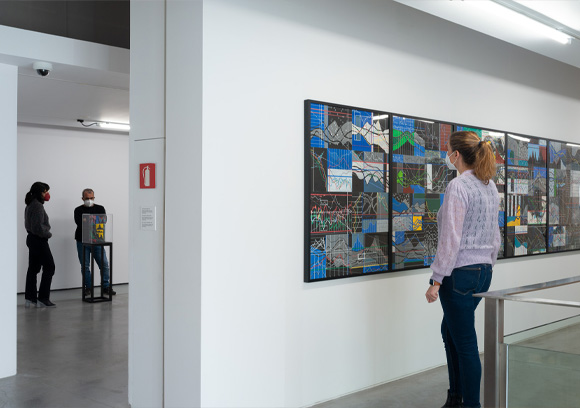
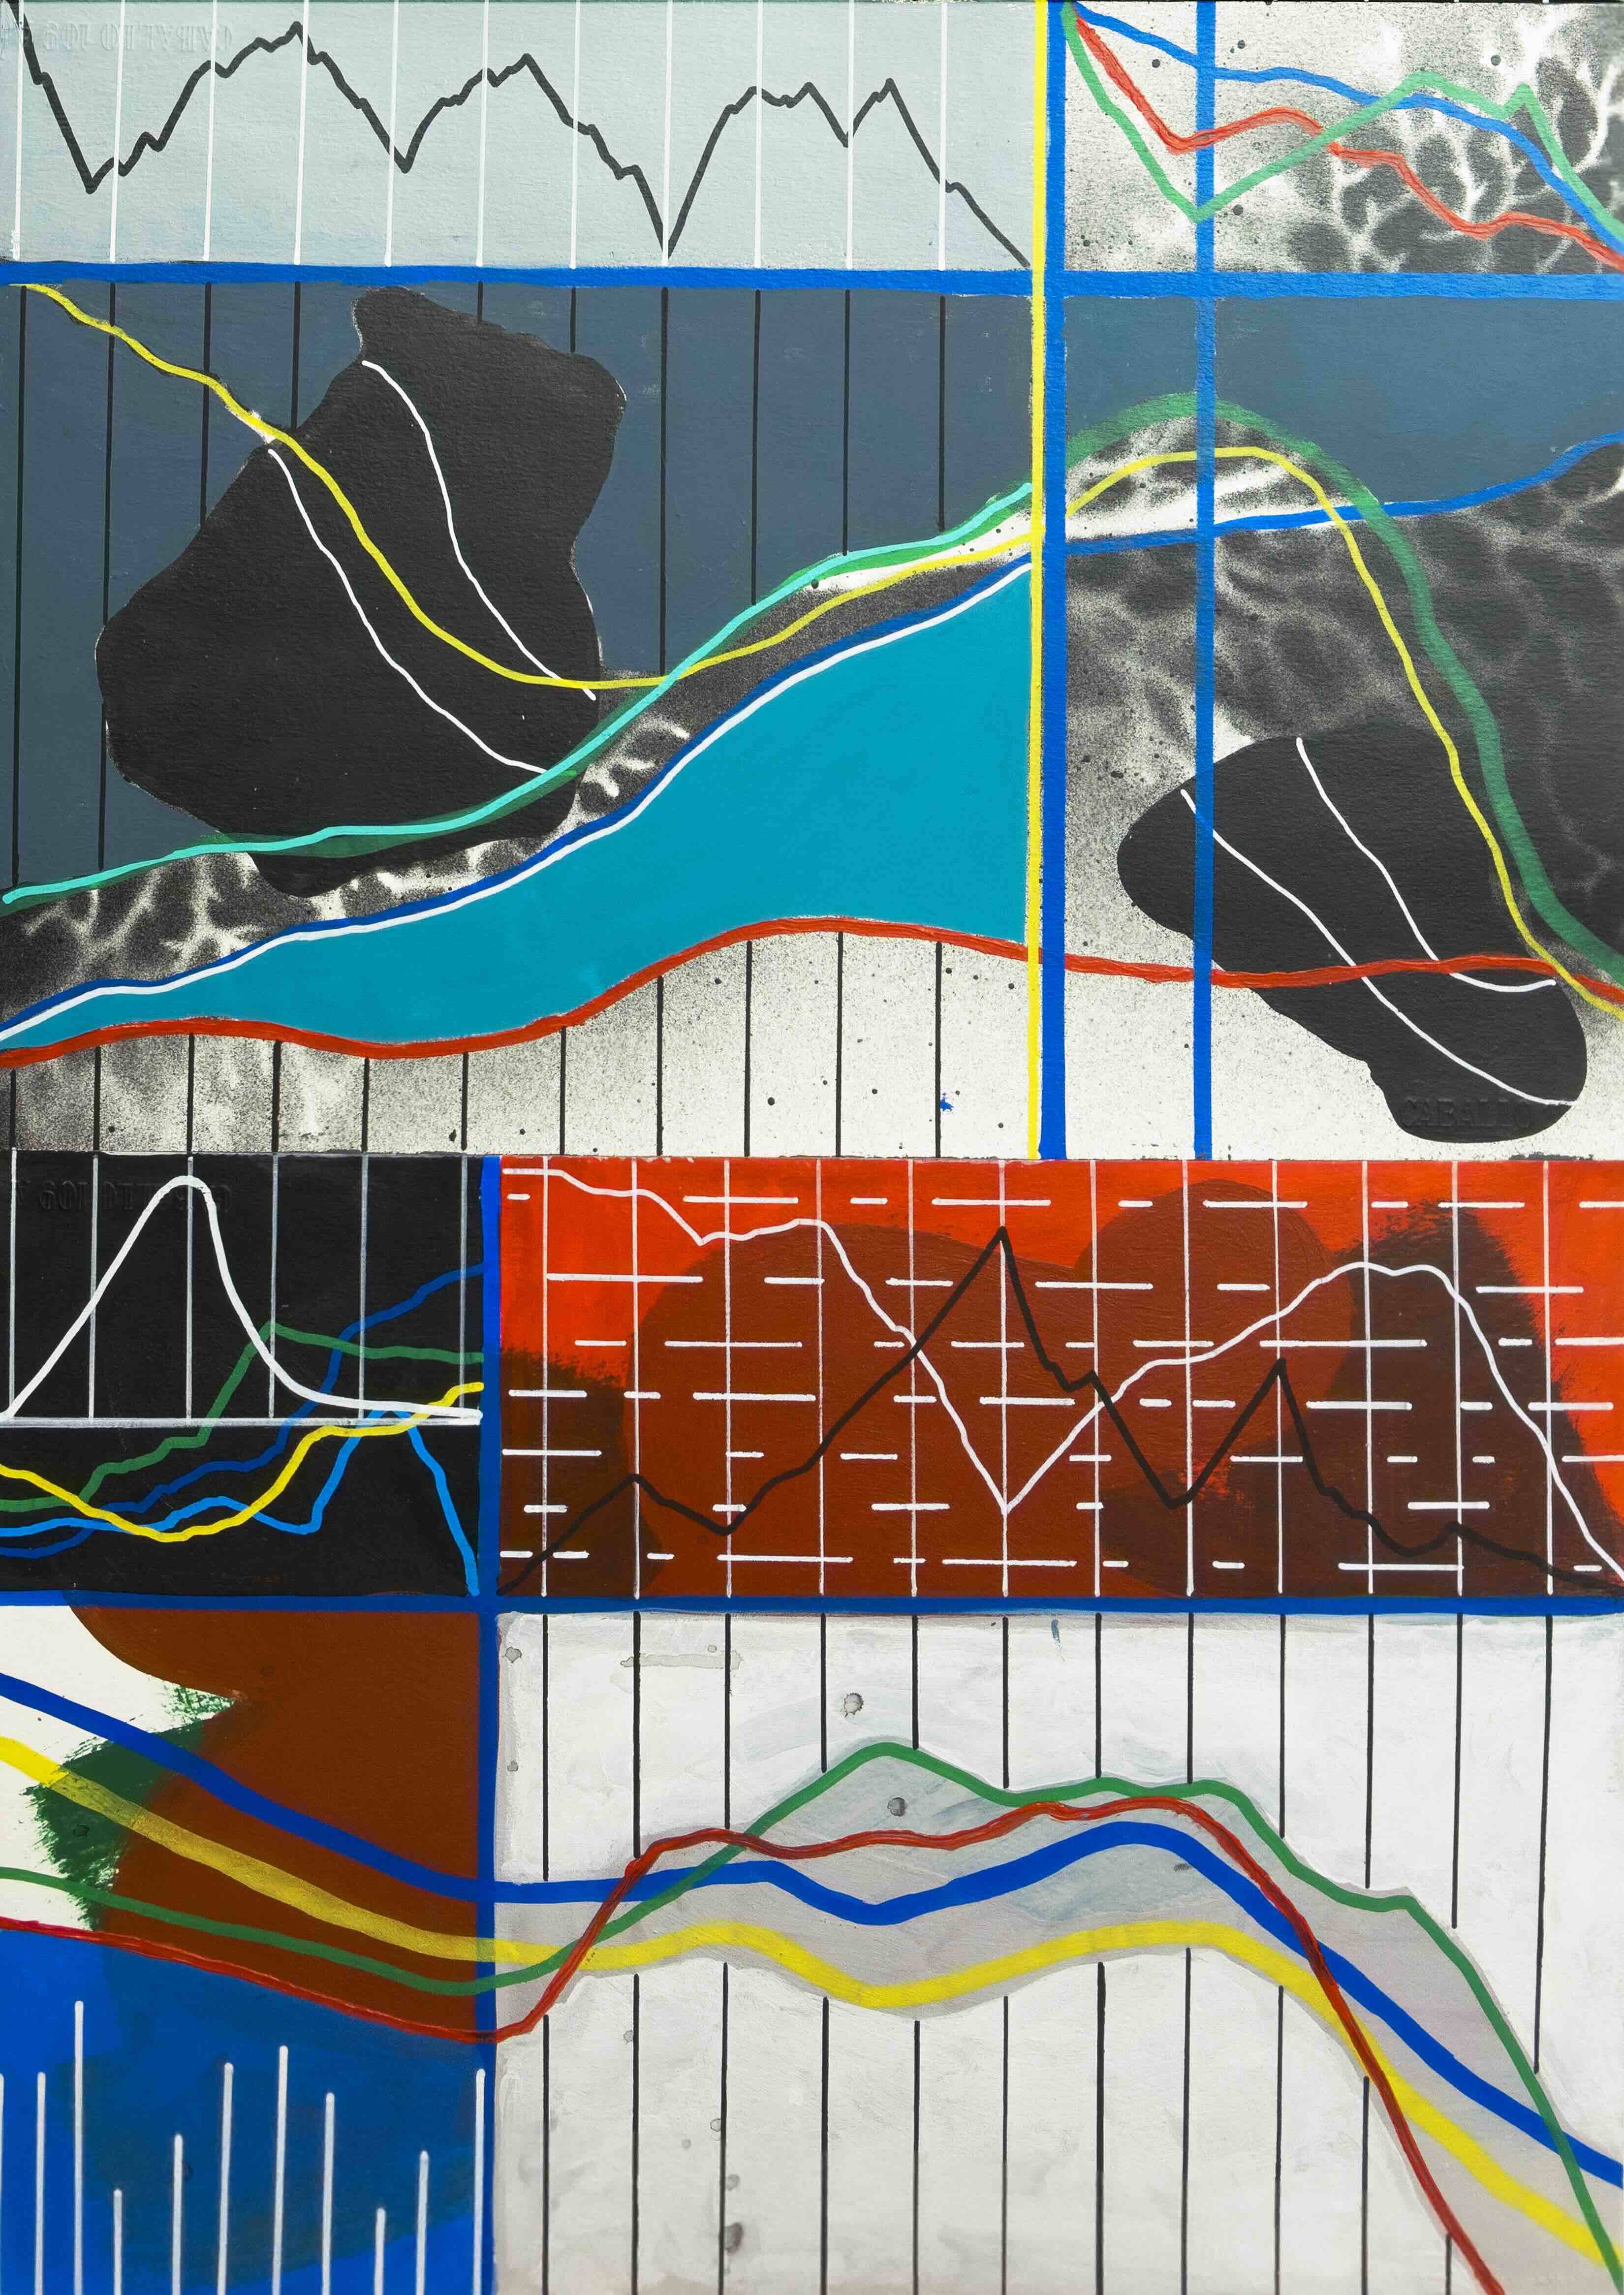
À l’acrylique sur fond noir ou blanc rectangulaire, les peintures « Calligraphies de l’inconnu » sont traversées horizontalement par des lignes présentant des inflexions courbes ou sous forme de pics. Les lignes colorées confèrent aux peintures des allures de graphiques résultant d’algorithmes mathématiques afin de produire une représentation visuelle de données chiffrées. La palette graphique des peintures est constituée souvent des couleurs primaires qui rappellent les écrans d’ordinateur, tels que ceux qui affichent les cours boursiers et rendent compte de leurs fluctuations depuis les années 70 avec l'arrivée de l’informatique.
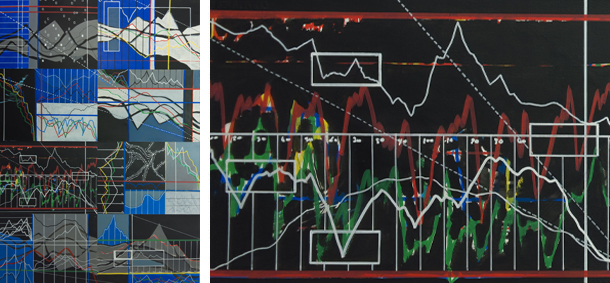
Mais comment comprendre ce langage abstrait alors que ne nous recevons aucune formation pour pouvoir lire ces graphiques boursiers qui défilent pourtant tous les jours sur nos écrans de télévisions dans nos journaux ou sur internet. Il est vrai que la représentation visuelle de l'historique d'une action est très loin d’être claire. On peut lire sur un graphe le passé d’une société, ses hauts et ses bas, les périodes les plus dures et les plus fructueuses de son histoire.
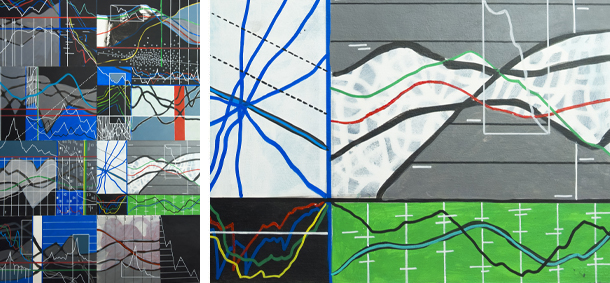
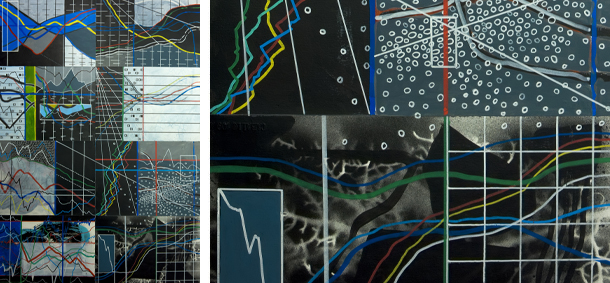
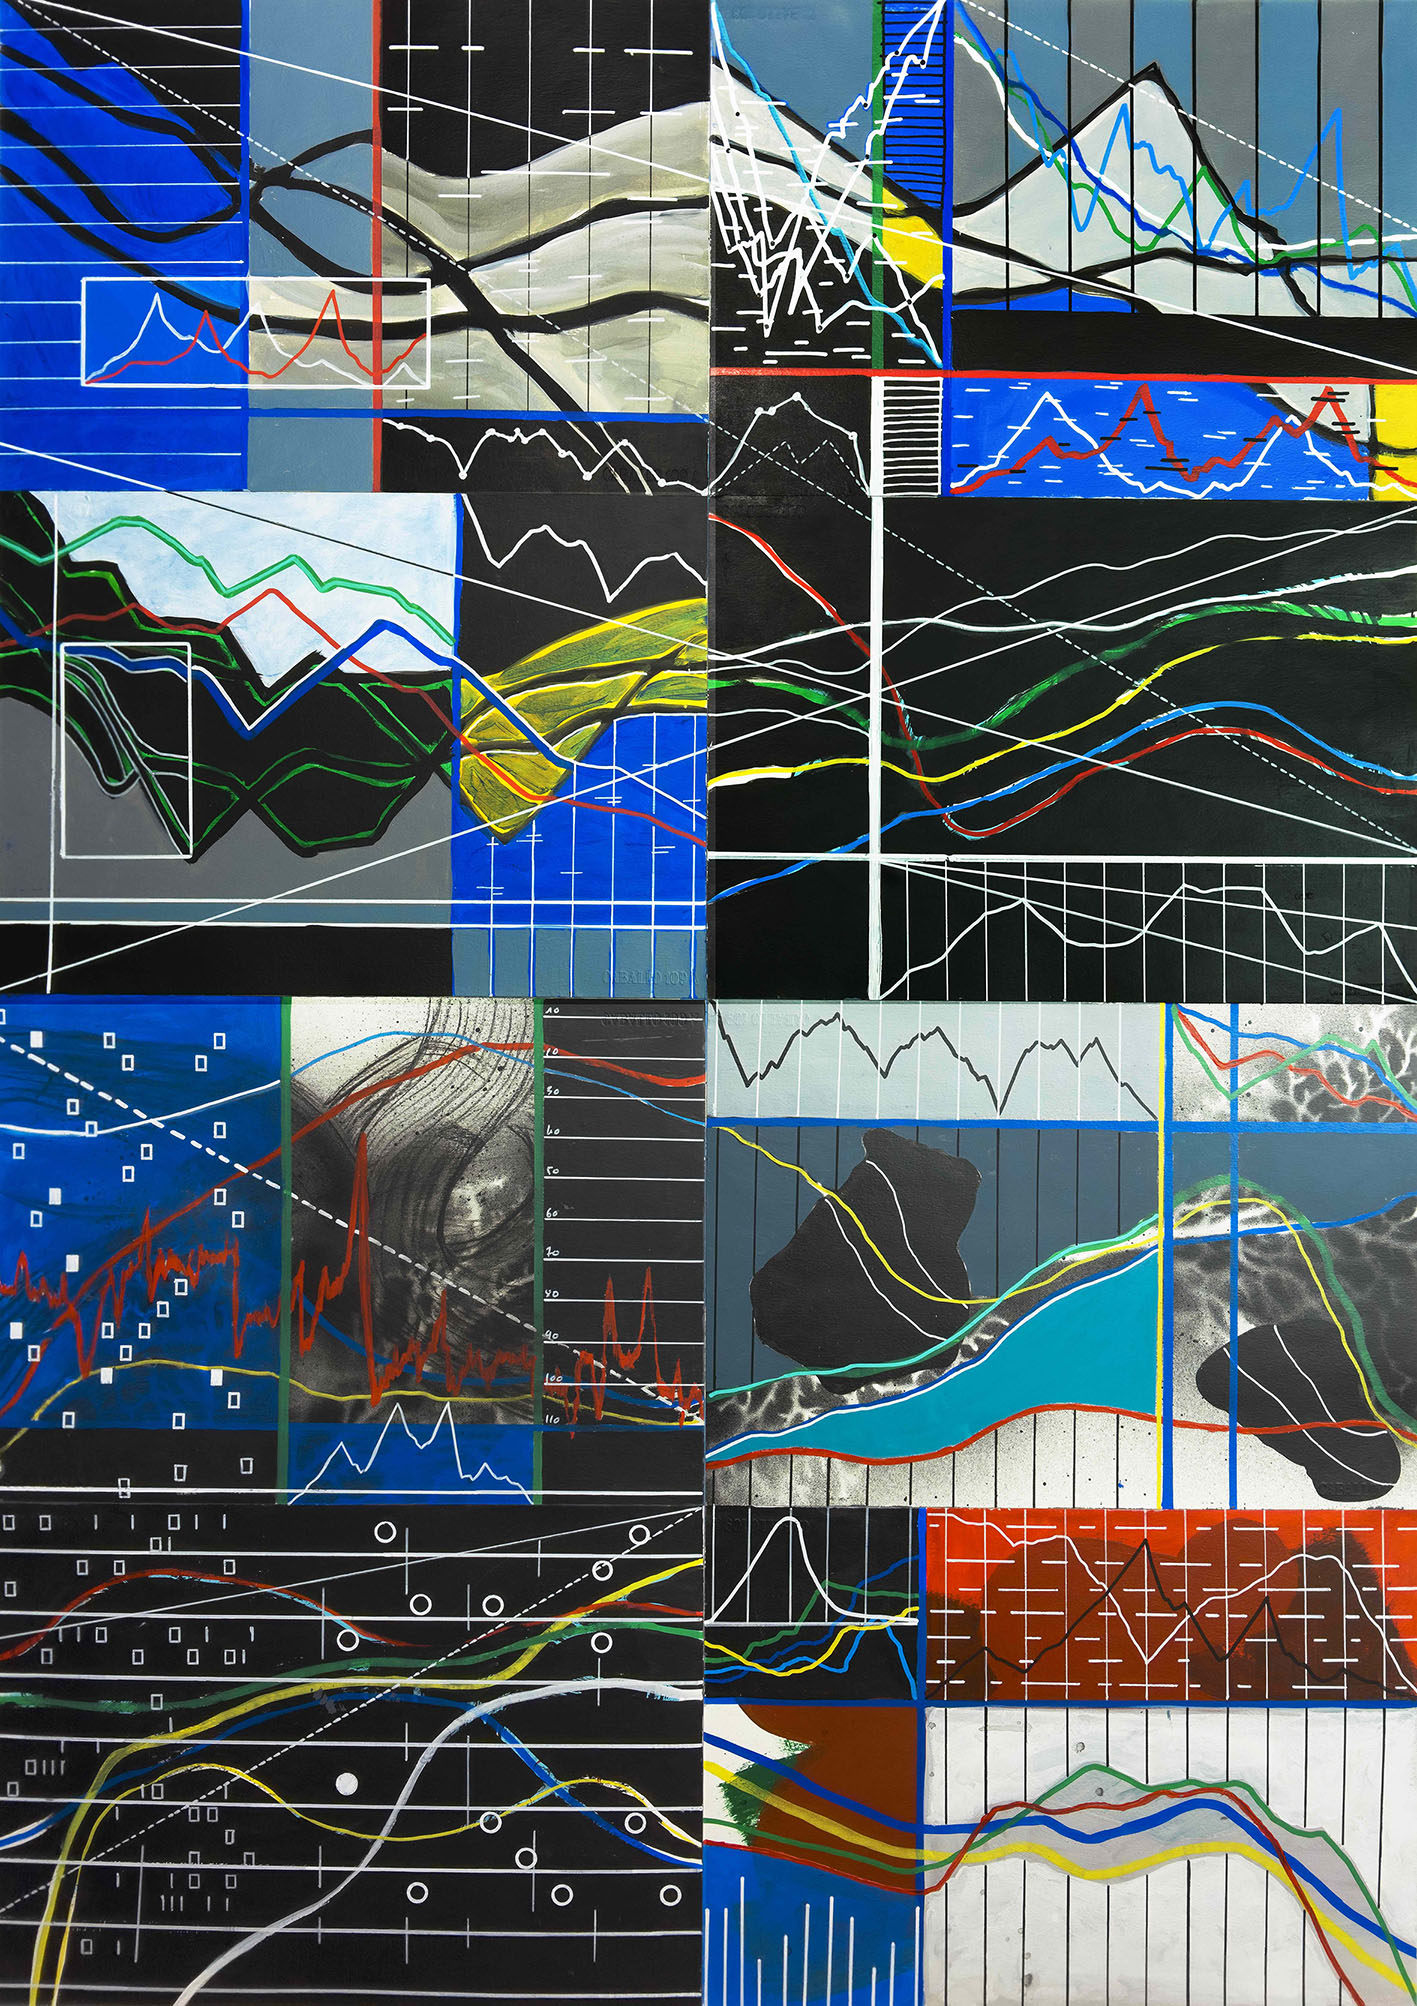
L’artiste s’est intéressé alors à la déconstruction de ce langage, mais avant tout, il fallait le comprendre. Ainsi on trouve, dans ses peintures les plus simples de tous les types de tracés : la courbe continue, qui représente les cours de clôture de l'action pour chaque jour reliés entre eux par une ligne. L'axe horizontal représente le temps et l'axe vertical celui des cours. Il y a aussi le graphique en barres ou ce qu’on appelle le « bar chart » qui permet d'afficher sur un graphique plusieurs données de cours : le cours d'ouverture, le plus haut et le plus bas de la séance ainsi que le cours de clôture. Le haut de chaque barre représente le cours le plus haut atteint pendant la séance, le bas des barres est le cours le plus bas de la séance. Puis il y a la technique des bougies ou chandeliers, qui est apparue au 18e siècle au Japon où il était utilisé pour noter les prix du riz. La méthode a été transposée aux marchés financiers et elle est fréquemment utilisée pour noter les historiques de cours sur un graphique. Comme pour les barres, les informations nécessaires à leur tracé sont au nombre de quatre : les cours d'ouverture, de clôture, le plus haut et le plus bas de la séance. À la différence des "bar charts", cette technique fait apparaître une notion supplémentaire ; si le cours a baissé pendant la période, le chandelier est noir, si le cours a monté, le chandelier est blanc. Notons que plusieurs conventions peuvent être utilisées pour les couleurs des chandeliers, ainsi au lieu du classique noir/blanc on peut trouver du rouge/vert.
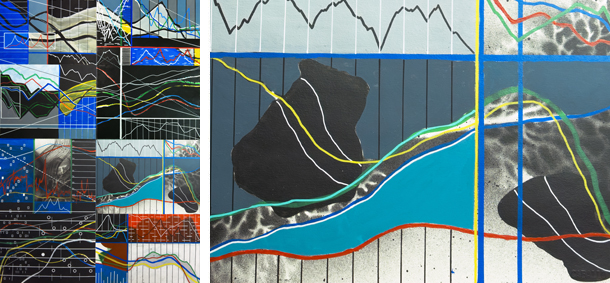
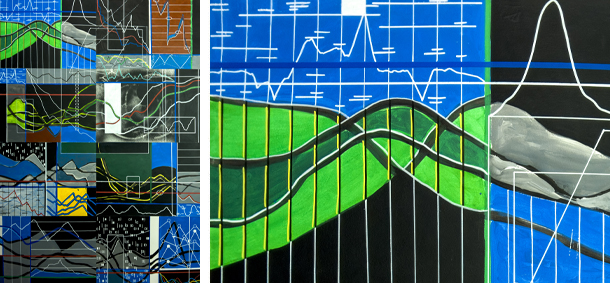
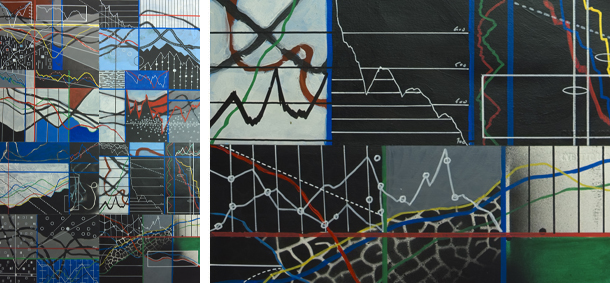
Les peintures « Calligraphies de l’inconnu » explorent un thème central de l’œuvre de mounir fatmi : le langage. Cette série picturale organise de ce fait la rencontre du langage graphique, inspiré de la calligraphie arabe, et du langage graphique de l’économie et des sciences économiques. Elles explorent l’existence d’un éventuel lien entre signes calligraphiques langagiers et signes géométriques représentant des données chiffrées liées aux activités économiques. On y observe la froideur des graphiques dissimulant leur réelle conséquence sur le vivant. Elle s’inspire pour une part des travaux de mathématiciens, séduits par la possibilité de présenter les fluctuations des marchés financiers sous forme de courbes aux allures extrêmement esthétiques, à savoir les fractales. La fractale, description géométrique des changements de marchés financiers, se propose comme une modélisation à la fois descriptive et prédictive des phénomènes étudiés.
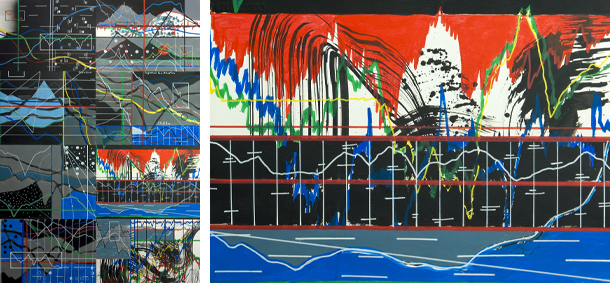
Dans ce travail, l’artiste tente de décoder ce langage contemporain et impénétrable qui pourtant influence notre vie quotidienne et l'équilibre de l'économie mondiale. Plaçant face à face les miroirs scientifique et artistique, il entraîne le spectateur dans un infini et vertigineux jeu de reflets.
Studio Fatmi, Octobre 2020.
|
|
Since the beginning of his artistic quest, mounir fatmi has found inspiration in the signs and shapes of Arab calligraphy. His discovery of Brion Gysin’s painting in Tangiers in the 1980s enabled him to see them from another point of view, that of a universal language. In 2014, he combined these calligraphic shapes with other geometric figures inspired by the graphics that represent the fluctuations of the stock market. He thus discovered the abstract and complex alphabet of the financial language. From there, he initiated the series of drawings and paintings entitled Calligraphies of the Unknown. He says: “In order to understand the world, one must measure the pulse of the financial markets, but also of the flea markets.”
Painted with acrylic on a black or white rectangular background, Calligraphies of the Unknown are crossed horizontally with lines forming rounded curves or sharp peaks. These colored lines give the paintings the aspect of graphics derived from mathematical algorithms created to visually represent data sets of numbers. The color palette of these paintings is often limited to the primary colors, evocative of computer monitors such as the ones showing stock exchange prices that have been relating their fluctuations since the advent of information technology in the 1970s.
But how could we possibly understand this abstract language, since we are not trained to read these financial graphics, although they stream before our eyes every day on our television screens, in our newspapers and on the internet? Admittedly, the visual representation of the record of a stock’s price is far from clear. One can read in a graphic a company’s past, its ups and downs, the hardest and most prosperous periods in its history.
So the artist took interest in the deconstruction of that language, but before anything, he needed to understand it. Which is why the simplest forms of graphic representations can be found in his paintings: the continuous curve, which represents the daily closing prices of a stock, connected together with a line. The horizontal axis represents time and the vertical axis the price. There is also the bar chart, which allows the representation on a single graphic of several types of information about the stock: opening price, highest and lowest price during the trading day, and closing price. The top of each bar represents the highest price reached during the day, the bottom its lowest price. And then there is the candlestick chart, invented in 18th century Japan, where it was used to record the price of rice. The method was transposed to financial markets and is often used to record price movements on a chart. Like with bars, four types of information are required to compile these charts: opening price, closing price, and the trading day’s highest and lowest. But contrary to bar charts, this technique introduces an additional notion: if the price went down during the trading day, the candlestick is black, if it went up, it is white. Note that there are several conventions for the color of the candlesticks: instead of the classic black & white, a green & red combination can sometimes be seen.
The Calligraphies of the Unknown paintings explore a central theme in mounir fatmi’s work: language. This pictorial series hence organizes the encounter between a graphic language inspired by Arab calligraphy and the graphic language of economics. It explores the existence of a possible link between language-based calligraphic signs and the geometric signs representing numbers related to economic activity. As a result, one can perceive the coldness of graphics that conceal their true consequences on the world of the living. This series is partly inspired by the work of mathematicians seduced by the possibility of presenting the variations of stock markets in the form of esthetically pleasing curves, namely fractals. The fractal, a geometric description of the variations on financial markets, is seen as both a descriptive and predictive modelling of the studied phenomena.
In this work, the artist attempts to decipher this modern and impenetrable language that nevertheless influences our daily lives and the stability of the global economy. Placing the scientific and artistic mirrors face to face, he entices the viewer into an endless and dizzying play on reflections.
Studio Fatmi, October 2020.
|